Look at the text below. In 25 seconds, please speak into the microphone and describe in detail what the graph showing. You will have 40 seconds to give your response.
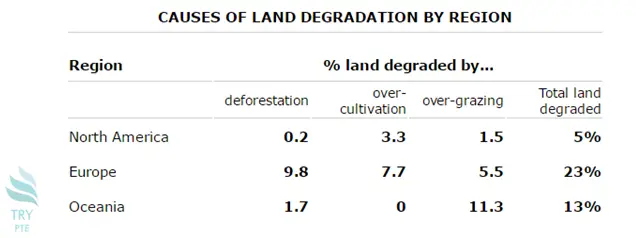
This graph shows the information about percentage of cause of land degradation by region. To begin with, we can see that there are three causes of land degradation in comparison, which are deforestation, over-cultivation, and over-grazing. According to the graph, the largest proportion goes to over-grazing in Oceania with the figure of 11.3%, while the smallest proportion goes to over-cultivation with the figure of 0%. Last but not the least, the highest number of total land degraded goes to Europe with the figure of 23%. In conclusion, to note that Oceania is a large group of islands in the South Pacific including Australian and New Zealand.
« Previous 261 262 263 264 265 266 267 268 269 270 271 272 273 274 275 276 277 278 279 280 Next»