Look at the text below. In 25 seconds, please speak into the microphone and describe in detail what the graph showing. You will have 40 seconds to give your response.
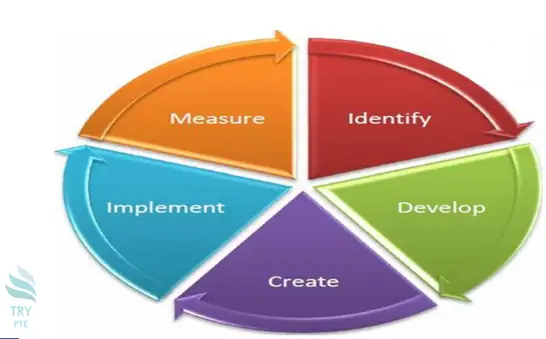
This flow chart shows the information about the processes flow chart of developing a system. To begin with, we can see that there are several sections in this picture, that is, identification, development, creation, implementation and measurement. According to the graph, it begins with the process of identifying the problems in the current system and prototyping a new system to review. Last but not the least, it ends with the process of measuring and maintaining the new system to see if it is applicable. In conclusion, I think it is very beneficial because it tells me the information of the processes flow chart of developing a system.
« Previous 201 202 203 204 205 206 207 208 209 210 211 212 213 214 215 216 217 218 219 220 Next»