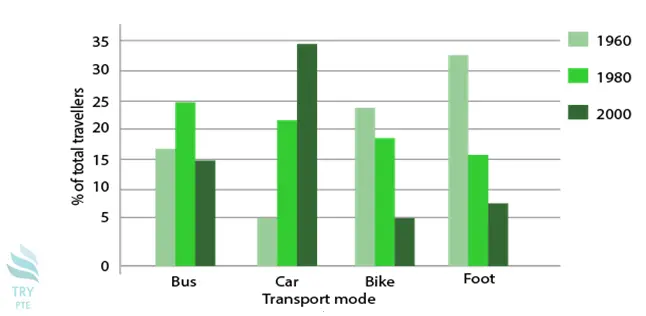
Look at the text below. In 25 seconds, please speak into the microphone and describe in detail what the graph showing. You will have 40 seconds to give your response.

The given bar graph shows the information about Transport mode in different years. To begin with, we can say that in the year 1960, people used to walk a lot and the maximum number can be seen of Foot which approximately 32%.In the year 1980, most of the people used to travel by Bus, and least by car. But as the time passed in the year 2000 people like to travel in their own private vehicle which is by car. Overall, we can say that people have a different mode of transportation according to different years.
« Previous 121 122 123 124 125 126 127 128 129 130 131 132 133 134 135 136 137 138 139 140 Next»