Look at the text below. In 25 seconds, please speak into the microphone and describe in detail what the graph showing. You will have 40 seconds to give your response.
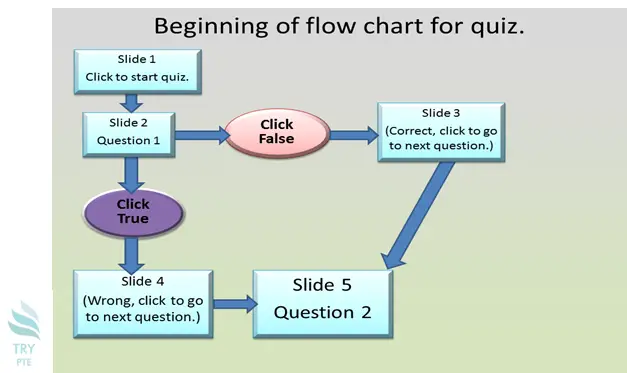
This flow chart shows the information about the flowchart of a quiz. To begin with, we can see that there are several sections in this picture, that is, slide 1 for clicking to start quiz, slide two for question 1, slide three for correcting, clicking to go to next question, slide 5 for question 2, slide 4 for wrong. According to the graph, it begins with slide one. When it goes to question 1, if the answer is true, than it goes to slide four. If no, then it goes to slide three. Last but not the least, it ends with slide five with the second question. In conclusion, I think it is very beneficial because it tells me the information of the flowchart for a quiz.
« Previous 201 202 203 204 205 206 207 208 209 210 211 212 213 214 215 216 217 218 219 220 Next»