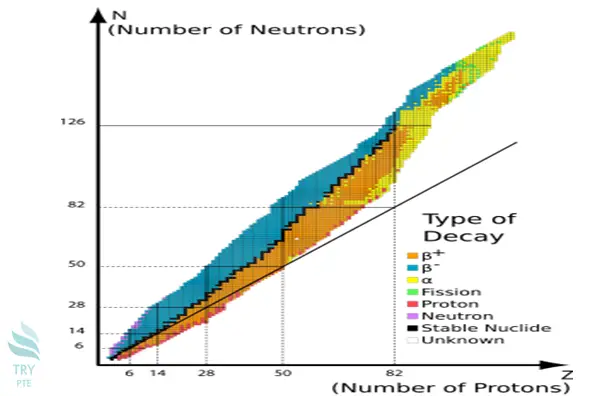
Look at the text below. In 25 seconds, please speak into the microphone and describe in detail what the graph showing. You will have 40 seconds to give your response.

This line chart shows the information about number of neutrons, number of protons and type of decay. To begin with, we can see that there are several categories, which are α,β, fission, proton, neutron and stable nuclide and unknown. According to the graph, the largest figure conies from the blue color, which is β-. It’s followed by the orange color, which is β+. Last but not the least, the smallest figure comes from the pink color, which means the neutron. In conclusion, it’s a very useful line chart.
« Previous 181 182 183 184 185 186 187 188 189 190 191 192 193 194 195 196 197 198 199 200 Next»