Look at the text below. In 25 seconds, please speak into the microphone and describe in detail what the graph showing. You will have 40 seconds to give your response.
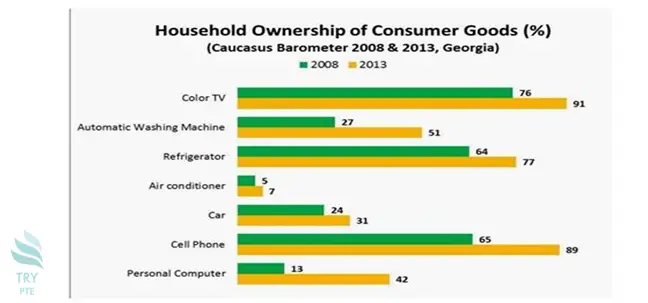
The given bar graph shows the information about household ownership of consumer goods in Caucasus Barometer 2008 and 2013 in Georgia. To begin with, we can see that there are several sections in this picture which are color TV, automatic washing machine, refrigerator, air conditioner, car, cell phone, and personal computer. According to this paragraph, in 2008, the largest number can be found in color TV which is about 76 while the smallest number can be found in the air conditioner which is about 5. Last but not least, in 2013, the largest number can be found on color TV which is about 76. In conclusion, in term of 2013, the smallest number can be found in air conditioner which is about 5.
« Previous 101 102 103 104 105 106 107 108 109 110 111 112 113 114 115 116 117 118 119 120 Next»