Look at the text below. In 25 seconds, please speak into the microphone and describe in detail what the graph showing. You will have 40 seconds to give your response.
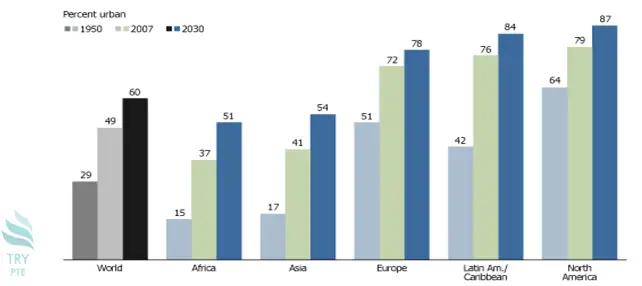
Percentage of Population in Urban areas
The given bar graph shows the information about the number of population in urban areas.To begin with, we can see that there are several sections in this picture, which are world, Africa, Asia, Europe,Latin America and North America.According to this paragraph, in 1950, the largest number can be found in North America which is about 64 while the smallest number can be found in Africa which is about 15.Last but not least, in 2007, the largest number can be found in North America which is about 79.In conclusion, in 2030, the largest number can be found in North America which is about 87.
« Previous 101 102 103 104 105 106 107 108 109 110 111 112 113 114 115 116 117 118 119 120 Next»