Look at the text below. In 25 seconds, please speak into the microphone and describe in detail what the graph showing. You will have 40 seconds to give your response.
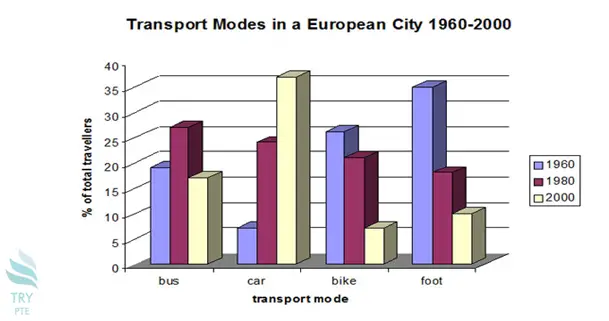
The given bar chart shows the information about transport modes in a European city from 1960 to 2000 in term of transport mode and % of total travelers. To begin with, we can see that there are several sections in this picture, which are the bus, car, bike, and foot. According to this paragraph, in term of 1960, the largest number can be found in the foot which is about 38%, while the smallest number can be found in a car which is about 5 %. Last but not least, in term of 1980, the largest number can be found in a bus which is about 25%. In conclusion, in term of 2000, the smallest number can be found in a bike which is about 5%.
« Previous 101 102 103 104 105 106 107 108 109 110 111 112 113 114 115 116 117 118 119 120 Next»