Look at the text below. In 25 seconds, please speak into the microphone and describe in detail what the graph showing. You will have 40 seconds to give your response.
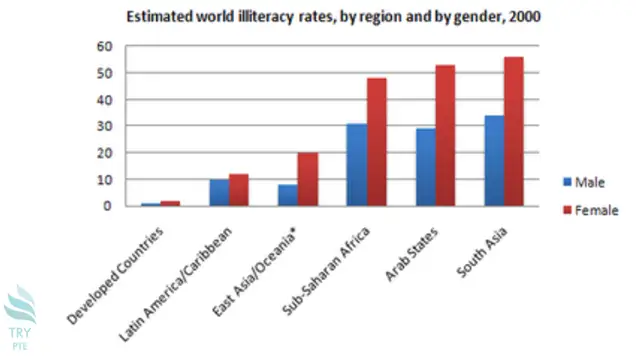
This bar chart vividly shows the information about estimated world illiteracy rates by region and by gender in 2000. To begin with, we can see that there are several sections in this picture, which are developed countries, Latin America/Caribbean, East Asia/Oceania, Sub-Saharan Africa, and South Asia. According to this paragraph, in term of male, the largest number can be found in South Asia which is about 30, while the smallest number can be found in developed countries which are about 1. Last but not least, in term of the female, the largest number can be found in South Asia which is about 30 dollars. In conclusion, in term of female, the smallest number can be found in developed countries which are about 2.
« Previous 101 102 103 104 105 106 107 108 109 110 111 112 113 114 115 116 117 118 119 120 Next»