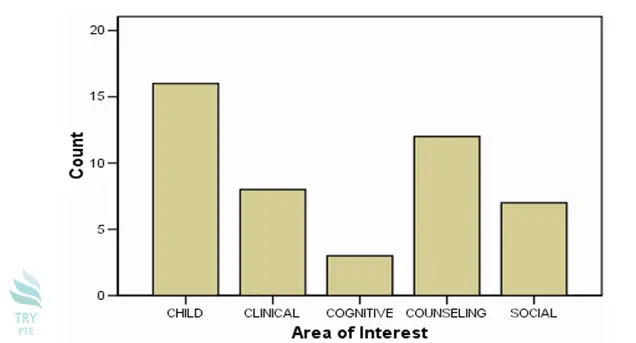
Look at the text below. In 25 seconds, please speak into the microphone and describe in detail what the graph showing. You will have 40 seconds to give your response.

The given bar graph shows the information about an area of interest among child, clinical, cognitive, counseling and social. According to the graph, a child has the maximum number of count that reaches approximately 16% and the least number can be seen on cognitive approximately 3%. Social and clinical can be seen almost on the similar trend. Overall, we can say that child and counseling has the maximum area of interest.
« Previous 101 102 103 104 105 106 107 108 109 110 111 112 113 114 115 116 117 118 119 120 Next»