
Look at the text below. In 25 seconds, please speak into the microphone and describe in detail what the graph showing. You will have 40 seconds to give your response.
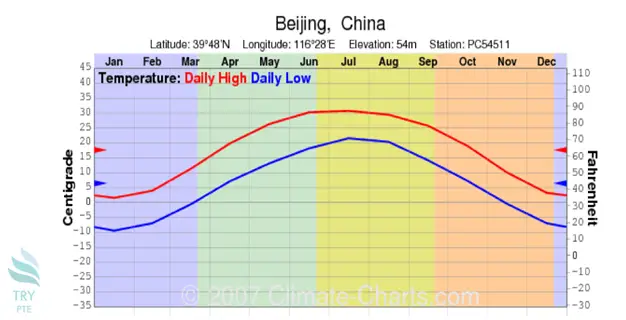
The given line chart provides the information about the monthly changes in temperature in Beijing over the year. It can be seen that the temperature of July is the highest which is 20 – 30 degrees. As well as temperatures for January and December are lowest which is approximate -10 to 0 degree.
« Previous 21 22 23 24 25 26 27 28 29 30 31 32 33 34 35 36 37 38 39 40 Next »